
Clonal Lineage and Cell Type Identity of Forebrain Interneurons in a STICR Single-Cell Dataset
Cortical interneurons are born in the developing forebrain and then migrate into the cortex. A basic question is how tightly a progenitor cell's lineage determines the identity of its descendants. STICR is a lineage-tracing method that tags a progenitor with a heritable DNA barcode, so cells sharing a barcode can be identified as one clone and their cell types read out together.
In this project I re-analyzed the published STICR data from the ground up: choosing which of the 13 libraries were usable, building a batch-corrected map of the cells, assigning formal interneuron labels from an Allen Institute reference, and testing whether sibling cells share an identity more often than chance would predict.
What I did
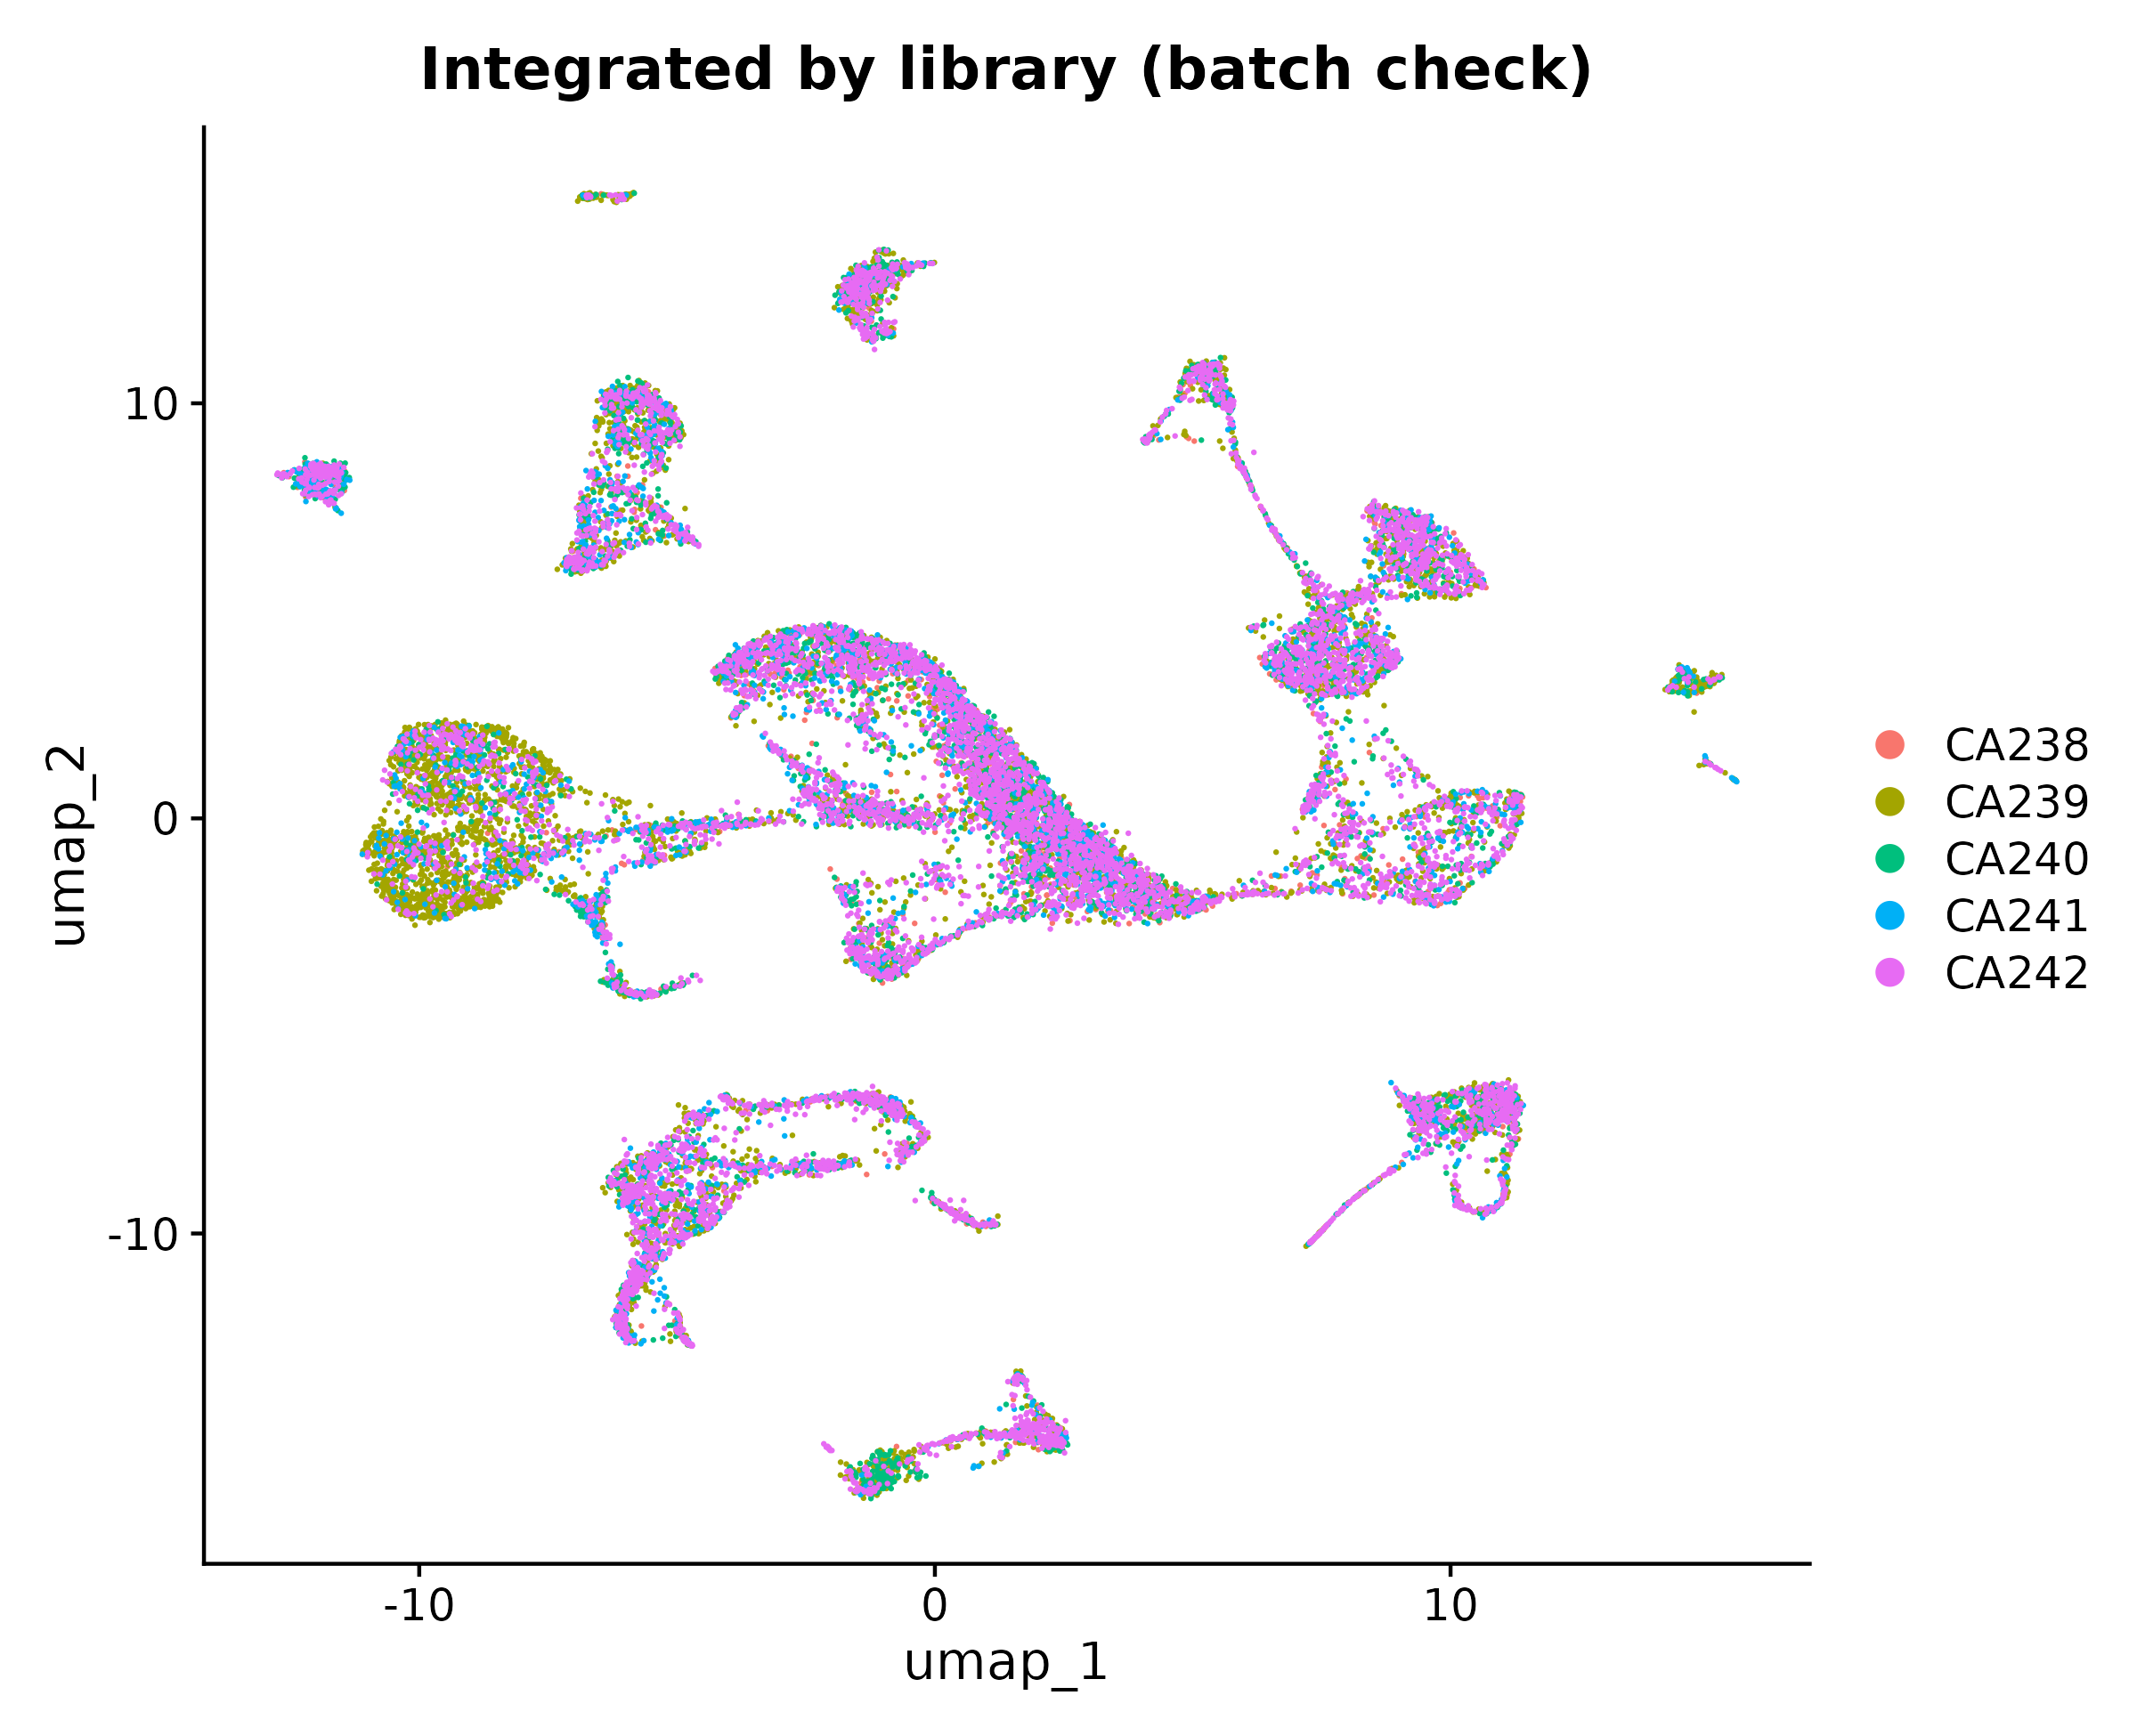
1. Picked the data. I scored each library on cell count, the share of cells linked to a clone, and clone size. Five libraries (CA238 to CA242) were clearly strongest, and I combined them with Harmony batch correction. The libraries blended rather than splitting into separate islands, which is the check that the correction worked.
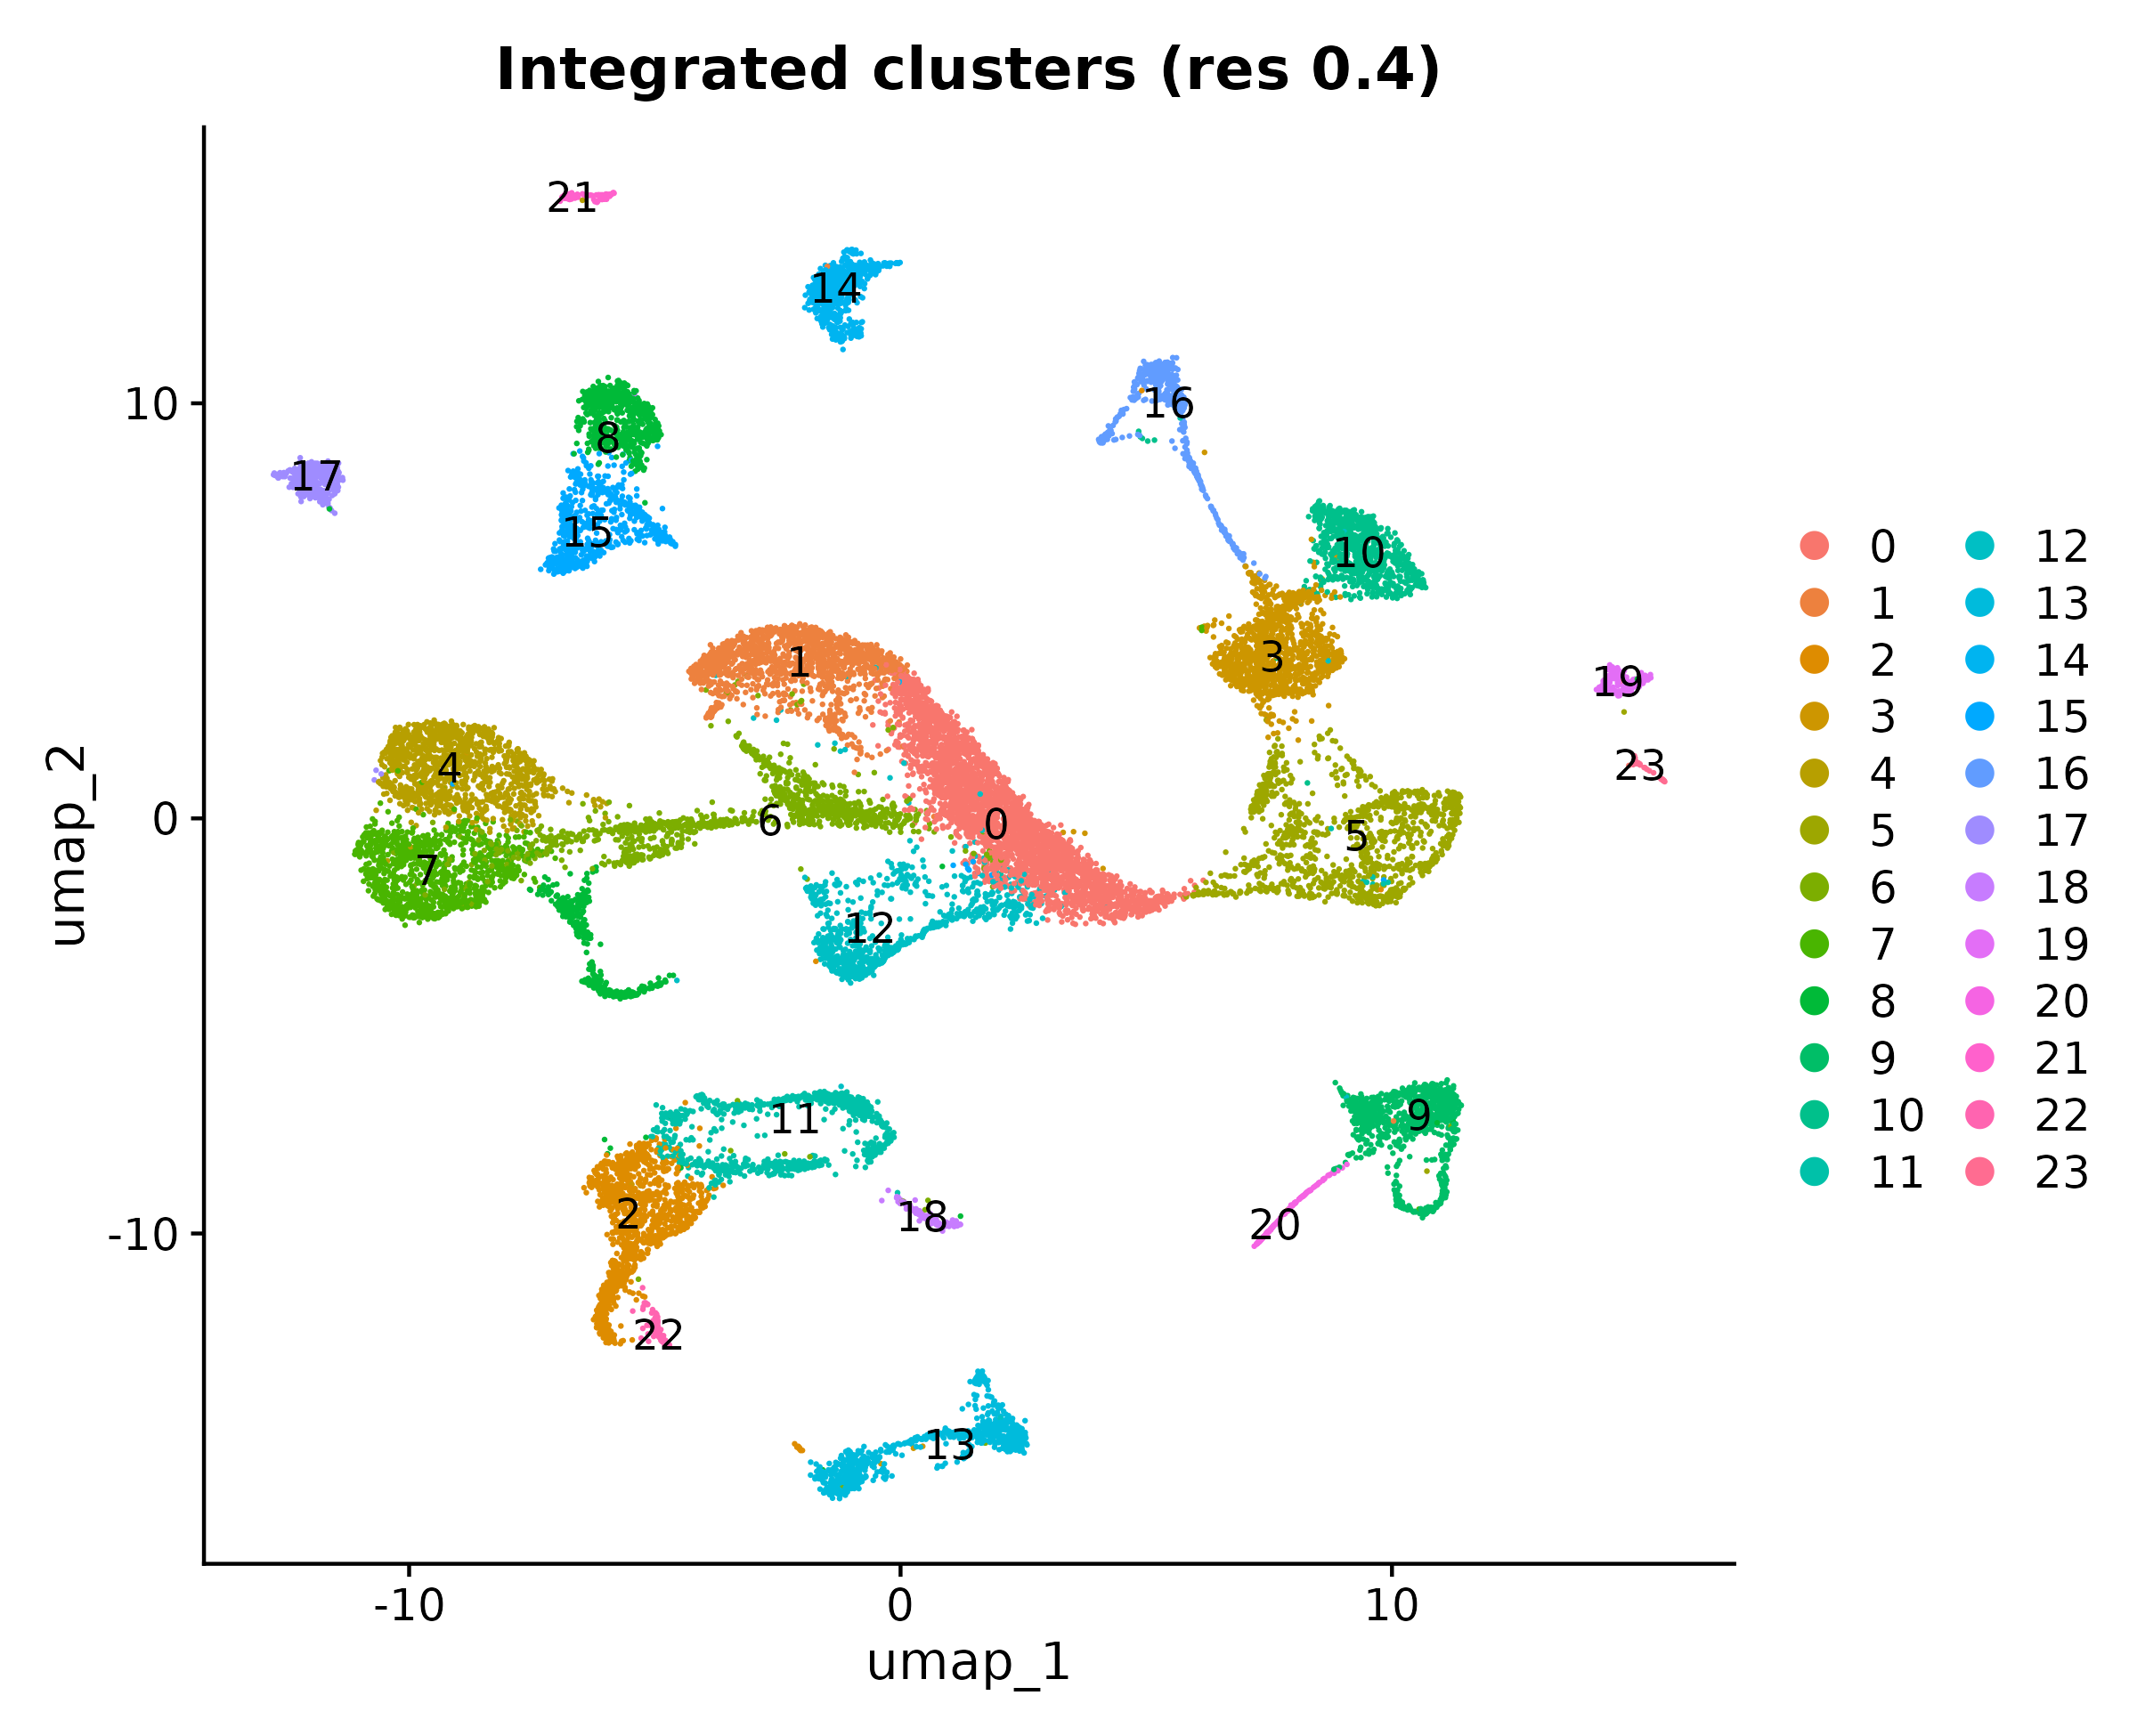
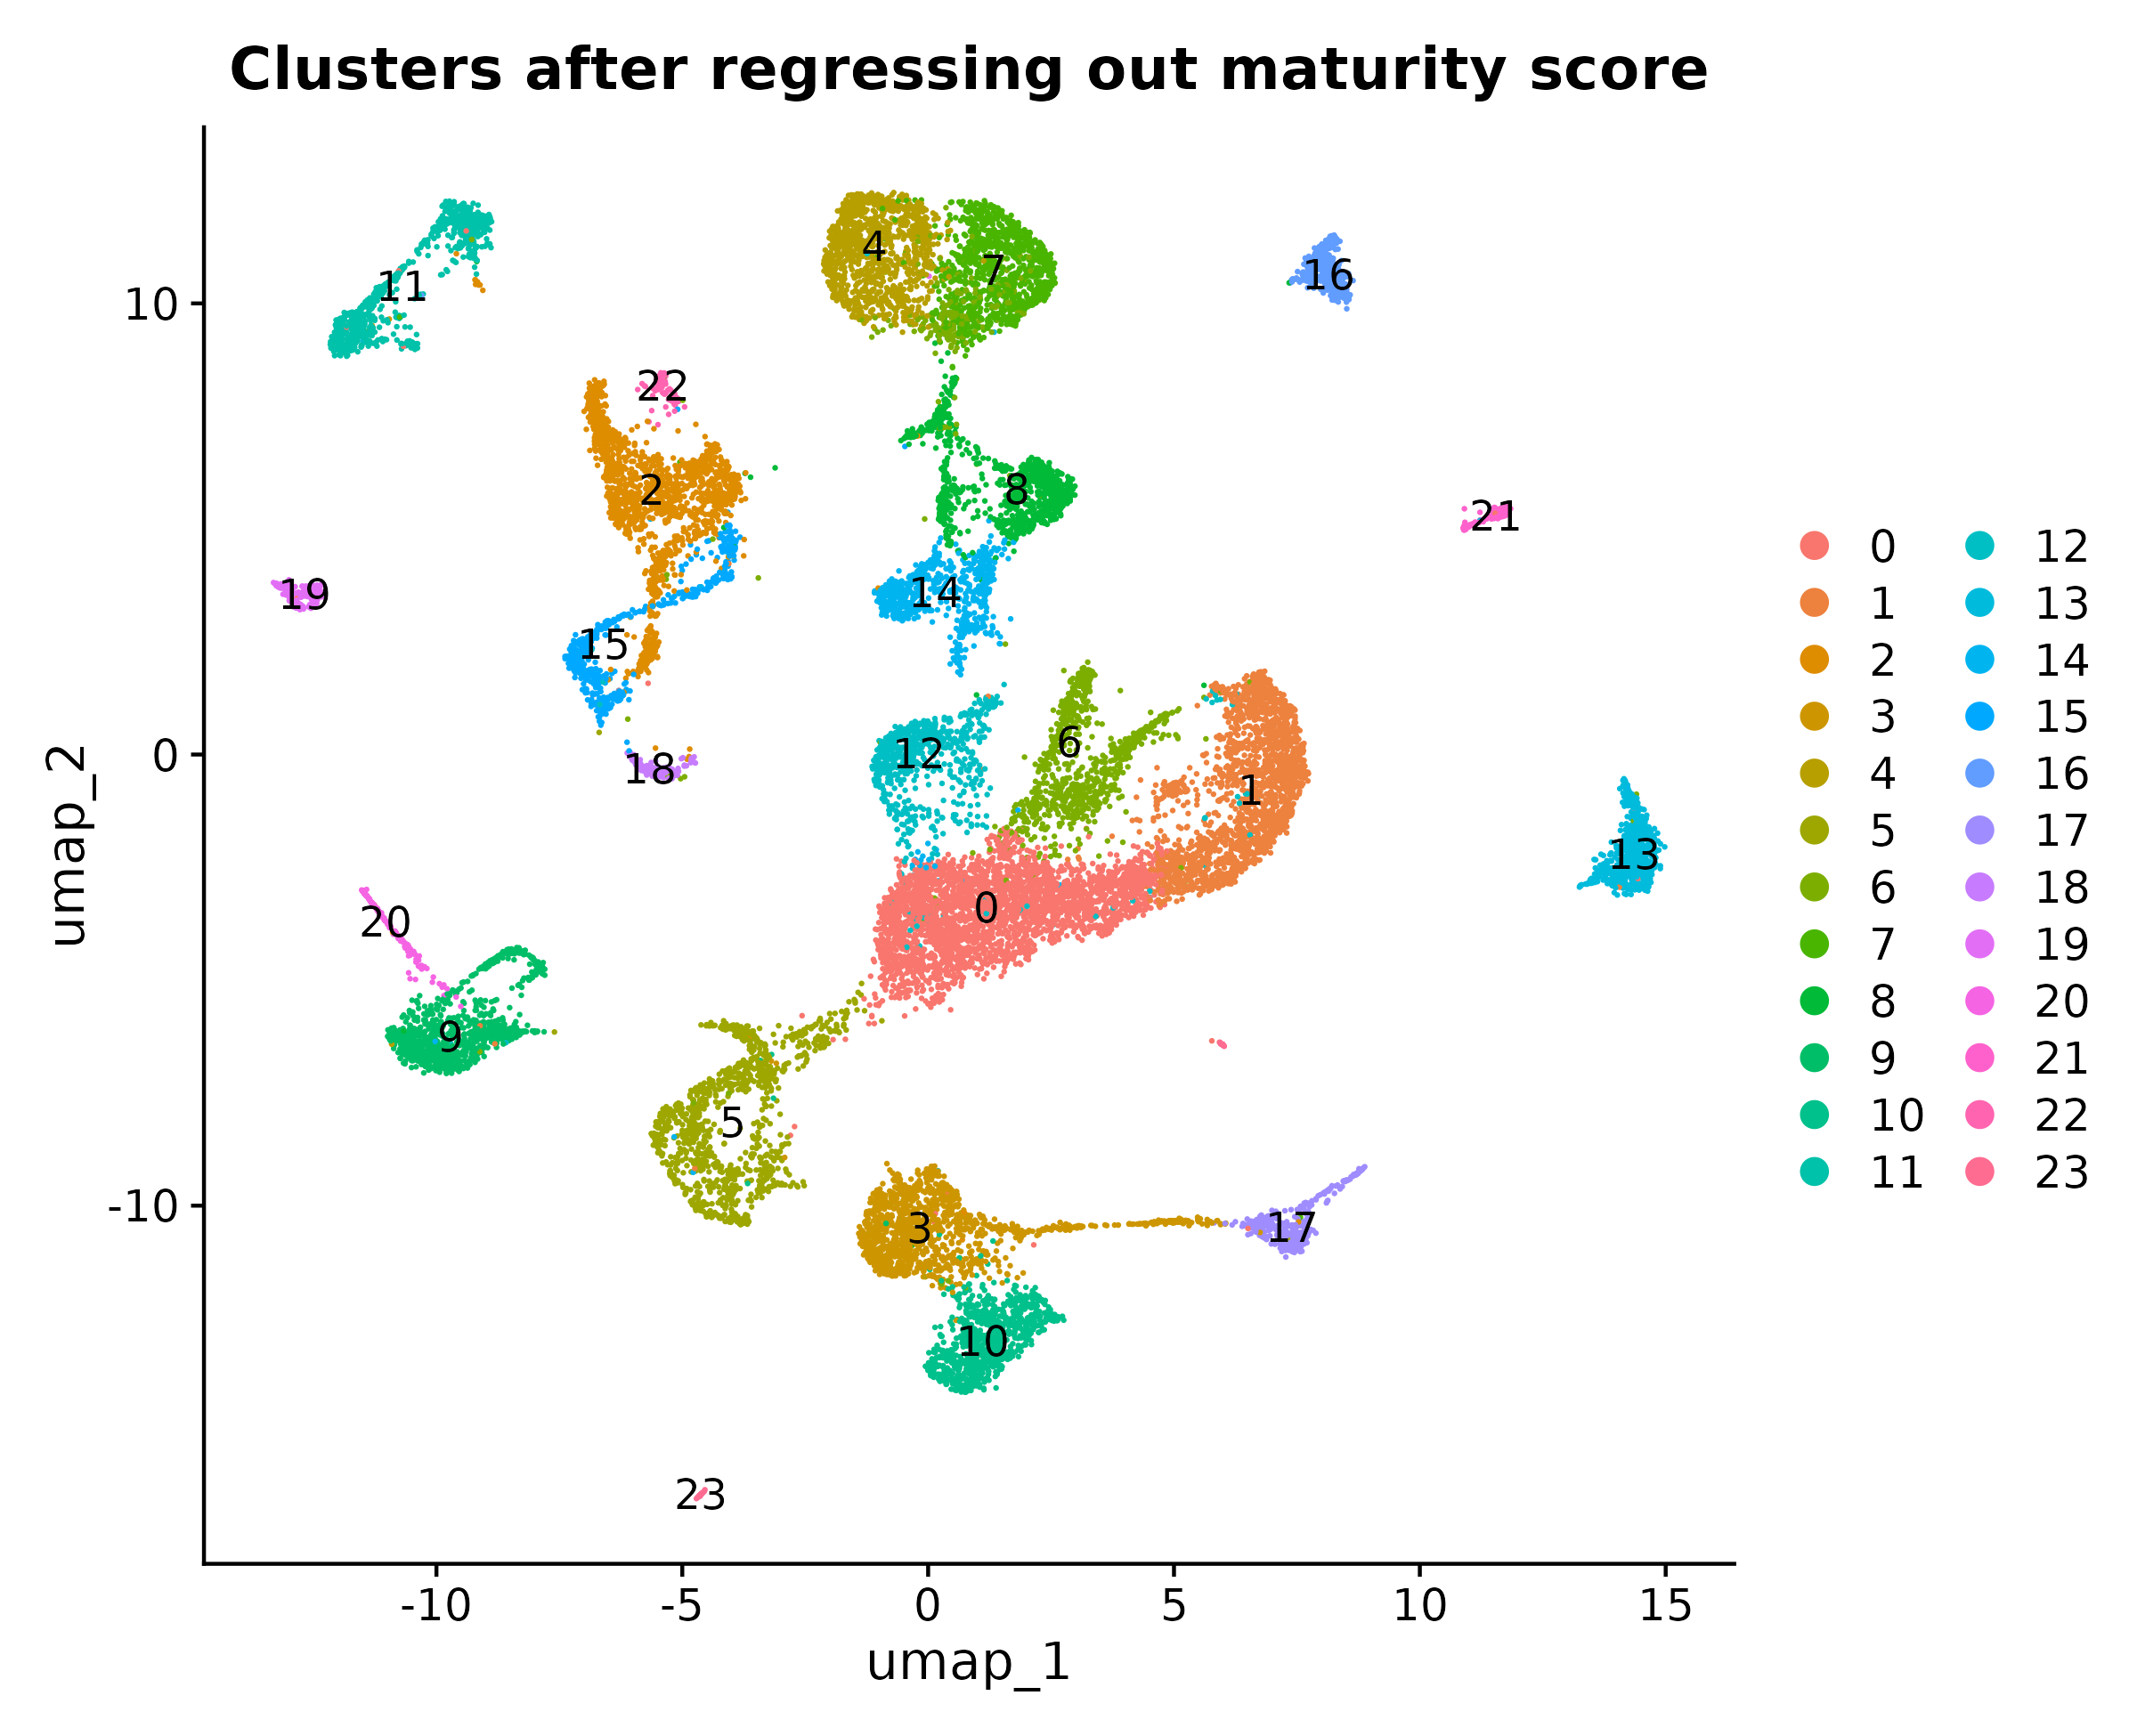
2. Separated cell age from cell type. Clusters of developing neurons can reflect how mature a cell is as much as what it is. I built a maturity score from general immature-neuron genes and regressed it out. A cluster first labeled as interneuron-lineage split in two: about 15% of its cells (472) were a striatal, non-interneuron population that had only been grouped with the interneurons because of developmental stage.
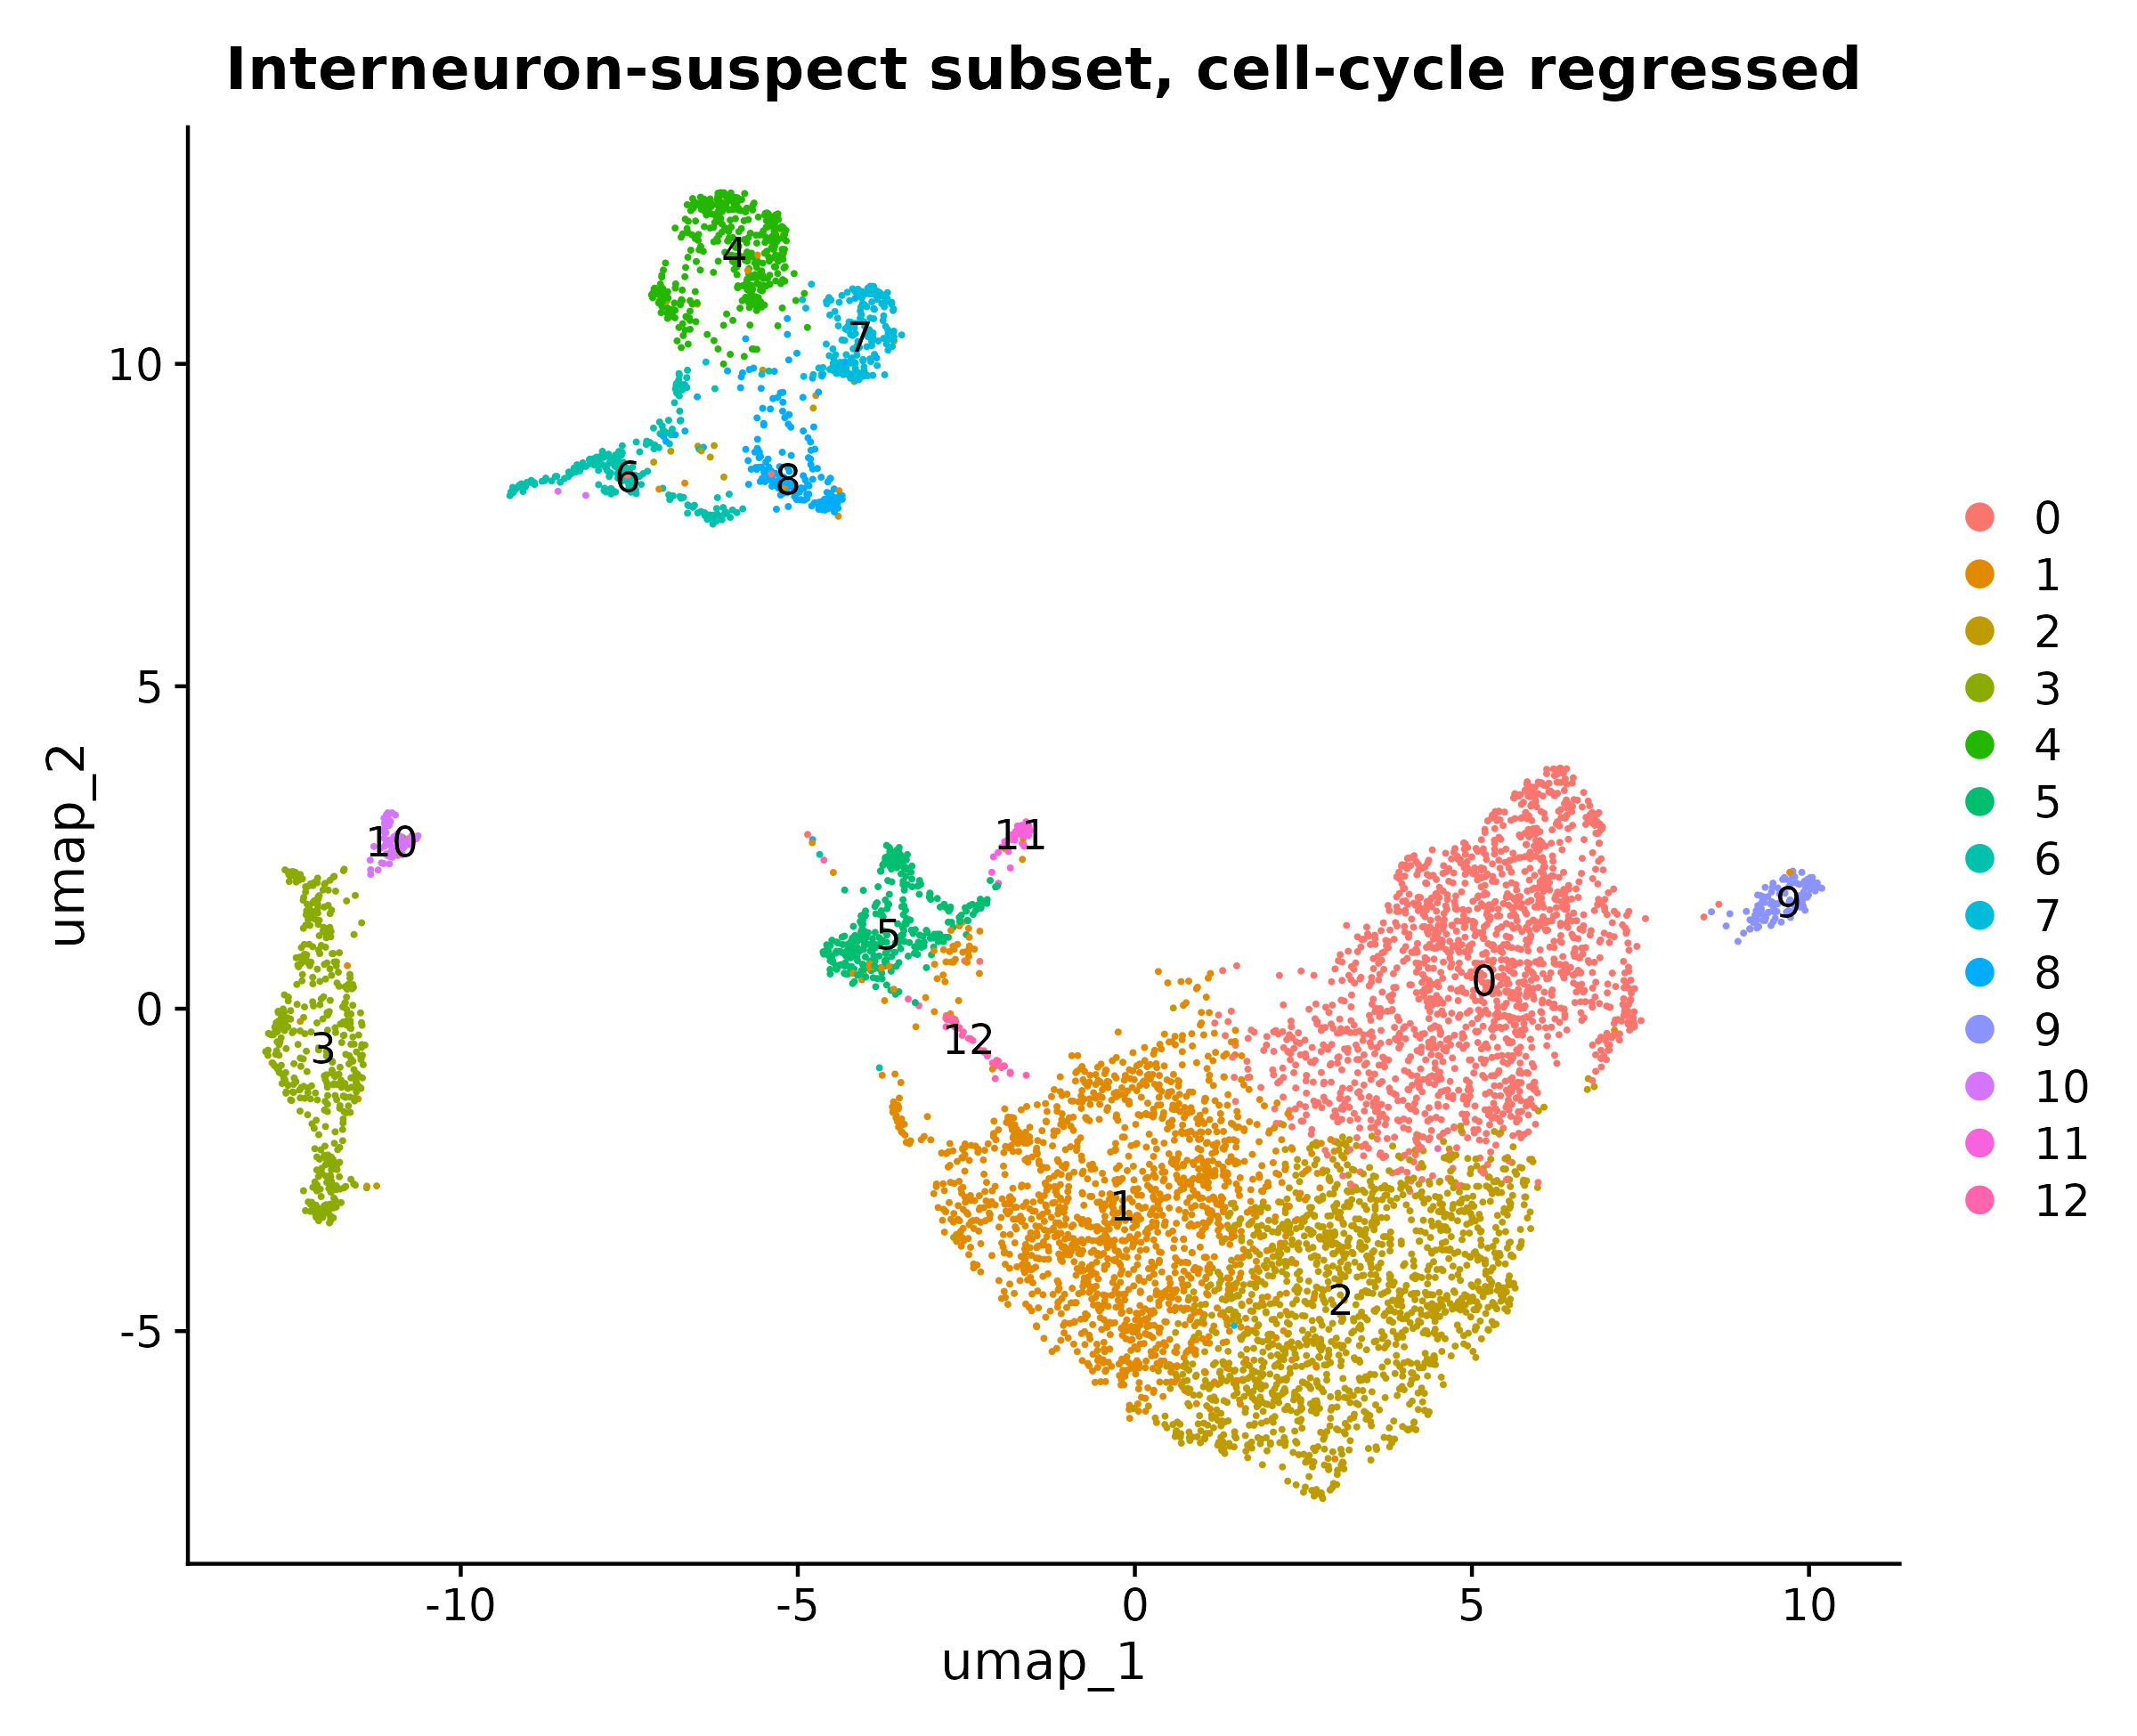
3. Zoomed in on interneuron candidates and corrected for cell-cycle stage. Re-clustering the candidate cells produced 13 subclusters. Six turned out not to be interneurons at all. Two had specific, well-established markers: an Nkx2-1+ MGE-lineage population and an Ndnf+ neurogliaform population. A second, gentler cell-cycle correction recovered both again, and spatial expression in the Allen Developing Mouse Brain Atlas agreed with both identities.
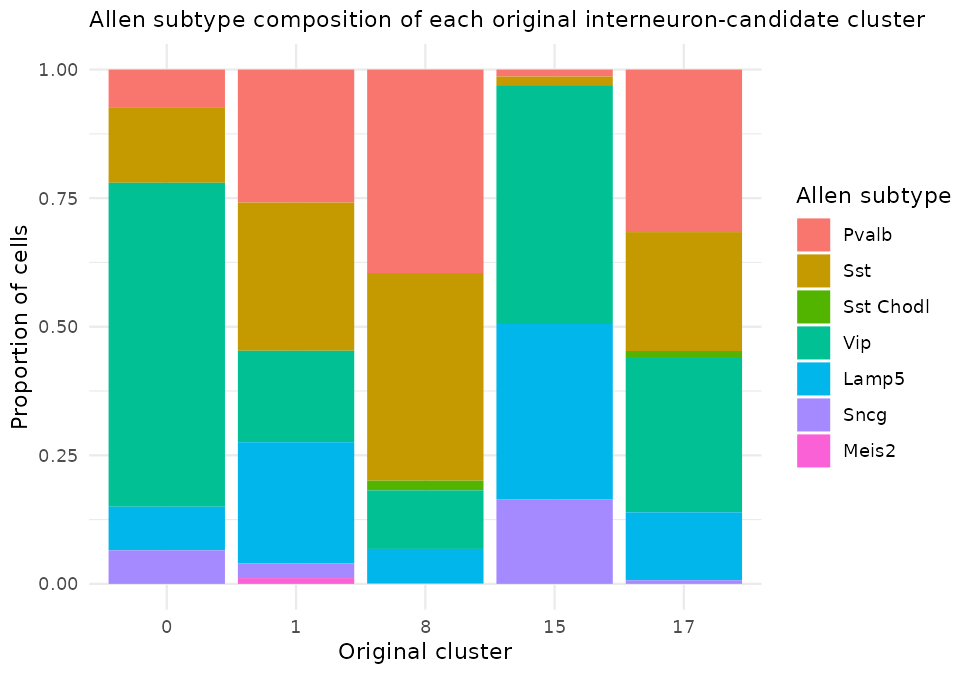
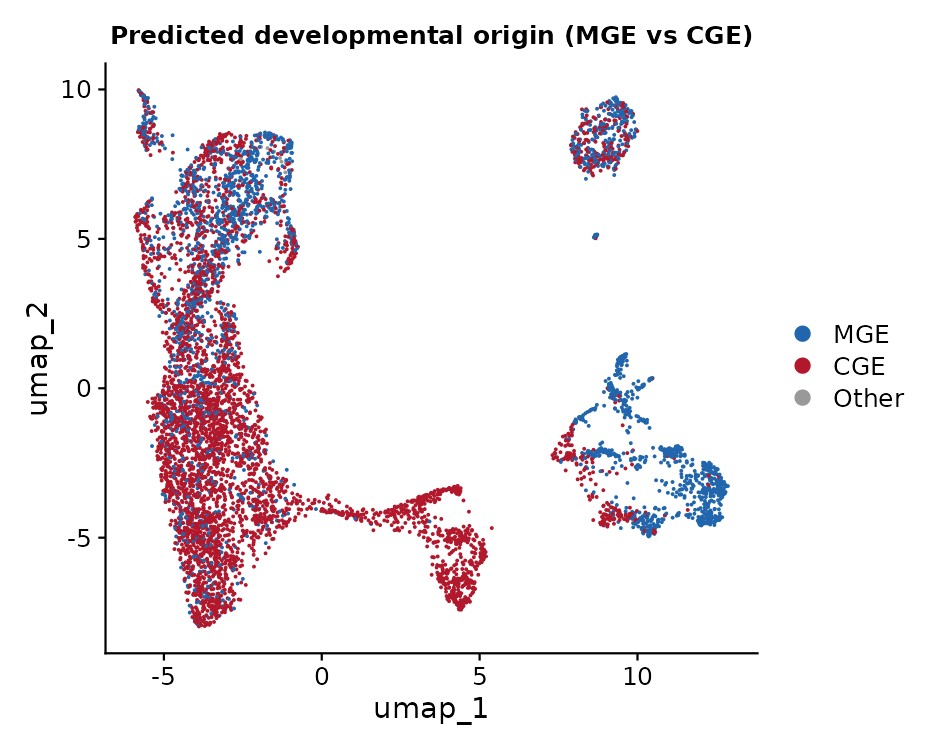
4. Matched cells to a published reference. I mapped 6,787 interneuron-candidate cells onto the Allen Institute's annotated mouse cortex dataset, narrowed to 4,469 ALM interneurons. This gave each cell an official subtype and developmental origin in place of marker-gene guesses. All seven subtypes were recovered, and 2,403 cells were assigned an MGE origin and 4,374 a CGE origin, reproducing the known split between the two.
| Allen subtype | Cells matched | Share |
|---|---|---|
| Vip | 2,867 | 42.2% |
| Sst | 1,405 | 20.7% |
| Pvalb | 1,147 | 16.9% |
| Lamp5 | 961 | 14.2% |
| Sncg | 367 | 5.4% |
| Sst Chodl | 24 | 0.4% |
| Meis2 | 16 | 0.2% |
What I found
Because the share of "restricted" clones depends on how many labels there are and how large the clones are, I compared each observed value with a null distribution built by randomly reassigning labels among cells while keeping the clone structure fixed (2,000 permutations).
| Level of comparison | Clones | Siblings sharing a label | Expected by chance |
|---|---|---|---|
| First-pass clusters (24) | 1,667 | 51.8% | 6.7% |
| Reference subtype (7) | 607 | 29.7% | 16.9% |
| Reference origin (MGE or CGE) | 607 | 57.8% | 45.3% |
Sibling cells shared the same subtype and the same developmental origin significantly more often than chance (p < 0.001), by about 13 percentage points at each level. The effect got stronger when I kept only confidently labeled cells: with a prediction score of at least 0.7, 69.0% of clones were restricted by subtype versus 27.4% expected. That suggests part of the apparent mixing in the full set comes from uncertain labels rather than true biological mixing. Together, the results show that lineage carries real information about interneuron identity, while not fully determining it.
What this does not show
The 57.8% figure for developmental origin looks higher than the 29.7% for subtype mainly because there are only two origin categories, which raises the chance baseline to 45.3%. It should not be read on its own as evidence that fate is decided in two successive steps. The data fit a model where lineage constrains both the broad origin and the fine subtype, but they cannot tell a single-step process from a staged one. Likewise, the very high restriction among the four marker-confirmed subtypes (95.9% of 98 clones) used few categories, small clones, and cells chosen for strong marker expression, so I treat it with caution.
A dataset detail worth fixing
The public record lists a single embryonic age for the whole dataset. The source paper's per-library records show that this is only when the lineage-tracing virus was injected. The tissue was collected after birth, between postnatal day 5 and day 15. That resolves an apparent contradiction: Ndnf does not switch on until around embryonic day 18.5, so finding Ndnf+ cells is exactly what postnatal tissue should show.
Limitations
The reference describes adult interneurons, while the cells here were collected at P5 to P15, and prediction scores were moderate (median 0.57). Because the reference contains only interneurons, every cell received an interneuron label, including some striatal, excitatory, and glial cells left in the candidate set, which may inflate the Vip share. The reference covers cortex only, whereas whole forebrain was sampled. STICR captures partial clones, which can reveal divergence but cannot prove restriction. The spatial validation was a qualitative visual comparison.
Acknowledgments: I thank Dr. Gomez of the University of Bern, Switzerland, for mentorship and guidance throughout this project.
Key sources
- Bandler, R. C., et al. (2022). Single-cell delineation of lineage and genetic identity in the mouse brain. Nature, 601, 404-409.
- Yao, Z., et al. (2021). A taxonomy of transcriptomic cell types across the isocortex and hippocampal formation. Cell, 184, 3222-3241.
- Tasic, B., et al. (2018). Shared and distinct transcriptomic cell types across neocortical areas. Nature, 563, 72-78.
- Thompson, C. L., et al. (2014). A high-resolution spatiotemporal atlas of gene expression of the developing mouse brain. Neuron, 83, 309-323.
- Hao, Y., et al. (2021). Integrated analysis of multimodal single-cell data. Cell, 184, 3573-3587.
- Korsunsky, I., et al. (2019). Fast, sensitive and accurate integration of single-cell data with Harmony. Nature Methods, 16, 1289-1296.